6 Twitter Analytics Terms You Need to Know to Grow an Audience in 2021
Building a Twitter audience is a great way to grow your business. So, here are 6 Twitter analytics terms you need to know and how to measure them.
Having an audience on Twitter is no longer just for celebrities. If you’re interested in growing a business, getting a job, finding clients or selling products online you need to have an audience that engages with you.
And, to grow that audience you need to learn to master your analytics so you can see where you are making mistakes and correct them. With this in mind here are 6 Twitter analytics terms you need to know to grow an audience in 2021.
Terms We Need to Know and Why
There’s a lot of analytics terms out there and we could focus on all of them. However, if we did we would use a lot of time that we could spend on actioning our findings. So, instead I want to focus on the ones that yield the greatest return. That’s why in this post, I want to focus on 6 of the most important analytics terms that can have a measurable influence on our growth.
Impressions
Impressions is the metric you often see quoted by marketers and people looking to sell ads. It refers to the number of views the content gets. But, there is an important caveat in how it’s represented. If someone views the same piece of content twice it gets recorded as 2 impressions, not one. So, when someone says a million people viewed their content that could actually be 500,000 people viewing it twice.
However, even with this caveat, it’s important that we pay attention to impressions because they represent the reach of our content. For example, if we create amazing content but it only gets 10 impressions, it’s unlikely we’ll be growing our audience any time soon.
Engagements
Engagements are the total amount of interactions with our tweets. For example likes, retweets, quote tweets, comments and link clicks are all engagements.
When it comes to growing an audience, there’s a strong case to say engagements are more important than impressions. This is because engagements are actual proof that people like our content.
The more engagement we get, the more people we know like it. So, it goes to say that if we keep creating content in a similar vein to our content with the highest amount of engagements, more people will like it.
Another reason is engagements are important is because they can start a chain reaction. If people engage with our content, it can lead to more impressions and more impressions can lead to more engagement. In short, focus on creating content people will engage with and impressions should follow.
EPI (Engagements per Impression)
Otherwise known as our Engagement Rate, our EPI is the percentage of engagements we get per impression we get. We can calculate it by dividing our engagements by our number of impressions and multiplying by 100.
EPI is one of the most important metrics for growing an audience. While engagements and impressions both tell a story, they don’t give the complete picture.
EPI solves this by letting us see how our content is performing in relation to the number of people who saw it. This lets us find content that performed well so we can complete a postmortem on it and try to replicate the successful aspects of it again in the future regardless of the size of our audience.
Example Calculation
If we had 10 engagements and 100 impressions it would be 10 / 100 * 100 = 10%. This would be an amazing EPI percentage. Anything above 5% is generally considered to be great.
NF/PC (New Followers per Profile Click)
NF/PC or New Followers per Profile Click is an indication of how well our profile converts people to followers.
Great content will get people to your profile but then you need a great profile to seal the deal and make them follow you.
NF/PC allows us to test, measure and implement new ideas to see if there is a measurable change in our growth. We can experiment with variables such as profile image, banner, bio and pinned tweet to see if there are any improvements in our numbers.
Example Calculation
If we had 50 New Followers and 900 Profile Clicks it would be 50 / 900 * 100 = 5.5%.
PC/I (Profile Click per Impression)
If NF/PC is tracking how many people we convert into followers, we also need to track how many people visit our profile. This is where PC/I or Profile Click per Impression comes in. We want to see the rate at which people visit our profile after seeing our content.
We can combine PC/I with NF/PC to allow us to get a complete picture of the journey from people seeing our content to converting to a follower. By looking at these two metrics in tandom we can see where our issues lie. Is it that we struggle to get people to our profile? (Our content needs to improve.) Or, is it we get people to our profile but can’t convert them to followers? (Our profile needs to improve.)
Example Calculation
If we had 800 Profile Clicks and 6000 Impressions it would be 800 / 6000 * 100 = 13%.
Link Clicks
The final metric I want to cover in this post is link clicks. If you’re interested in growing your business or getting people to buy a product, you need to get people clicking on links in your tweets.
By tracking our link clicks, we can look back at our previous tweets to see how well they performed. We can then learn lessons from the best performing tweets and optimise our future content to get as many people as possible clicking on links.
Why Percentage Based Analytics Are Better
Throughout this post so far you may have noticed that there is 2 types of analytics I’ve discussed.
- Number Based
- Percentage Based
When it comes to measuring the growth of our account and optimising our content I believe that the best metrics to use are percentage based ones. This is for a couple of reasons.
Scale With Your Following
Percentage based metrics scale better with audience size. If you went on the raw number of engagements or impressions you get then as your audience grows you’ll always think your latest content is the best because it’s numbers are larger.
In fact, if you look at your EPI you may find that some of your older content when you had a smaller audience was actually better.
Allows for Past Comparison
As I elouded to in the last point with percentage based metrics you can compare your past and current performances with more clarity.
For example, for 2 pieces of content with different impressions to have the same EPI the number of engagements would also need to change.
When looking at percentages you can forget about the actual numbers and focus on the performance of the tweet regardless of when it was posted.
Accessing your Twitter Analytics
Now we’ve covered what analytics we need to look at and why we should be using percentage based metrics. Let’s cover the options we have for accessing our analytics.
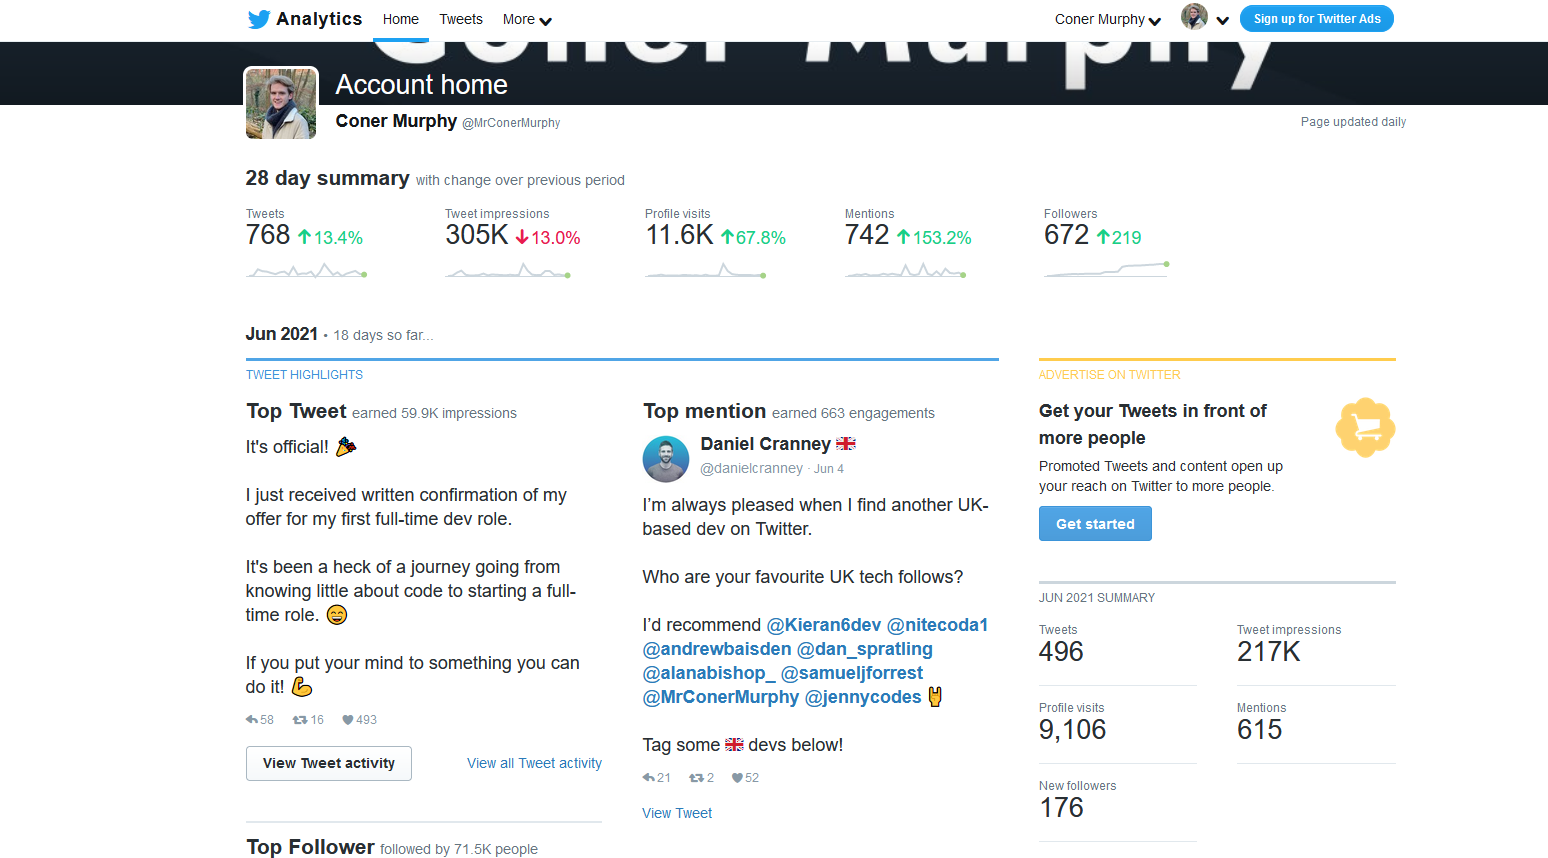
Built In Twitter Analytics
Twitter has a built in analytics platform that you can access for free here. This gives you access to all the information and data you need to calculate the metrics we have discussed above although with a bit of math on your part.
Third Party Options
However, if you’re looking for more analytics, data, dashboards or features there are plently of third party options available to us. Here are a couple of my favourites.
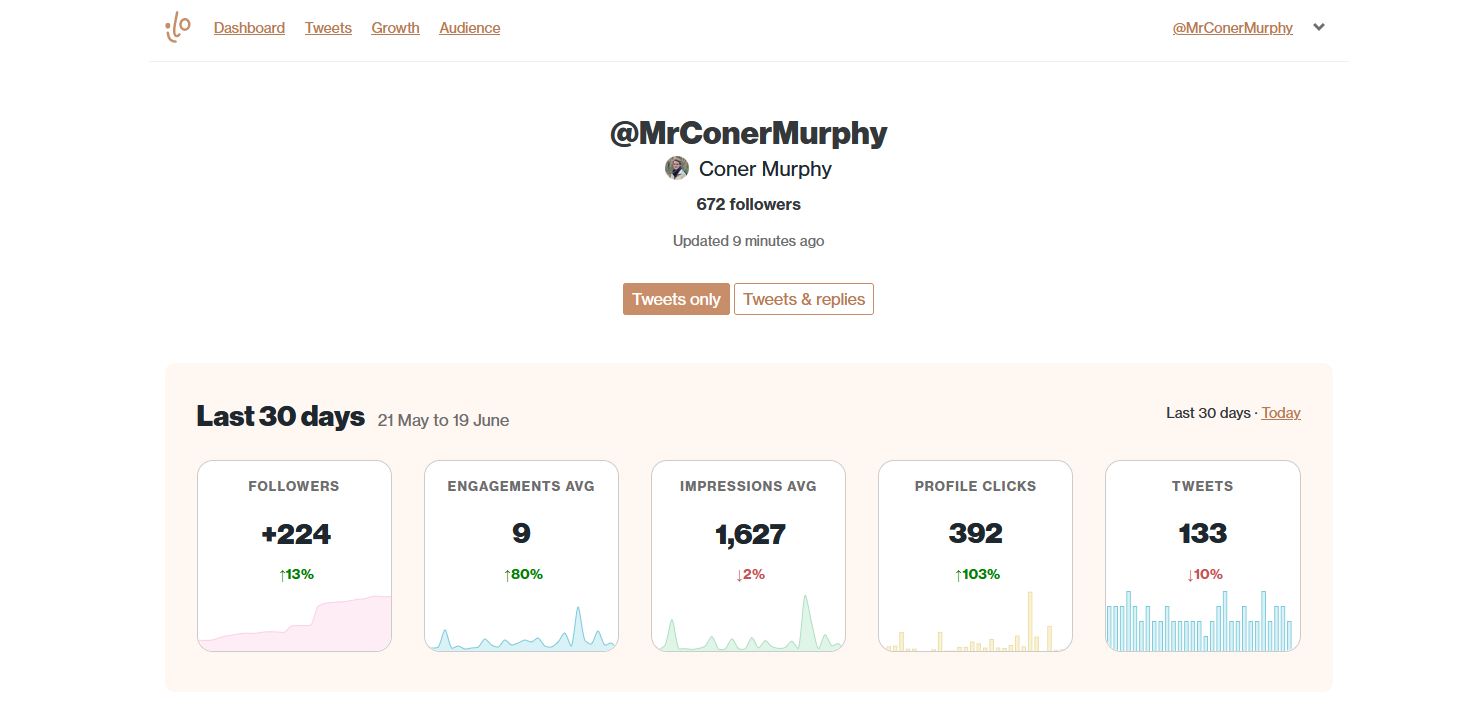
Ilo.so
Ilo.so is an analytics tool that gives great insights, dashboards, graphs and more. It gives a comprehensive breakdown of your Twitter performance in a matter of seconds and is a vital tool for building your audience. You can also setup public dashboards to see how other people are performing. For example, you can check out my dashboard here.
If you’re interested in checking out Ilo.so, you can get a free 14 day trial by going to their website.
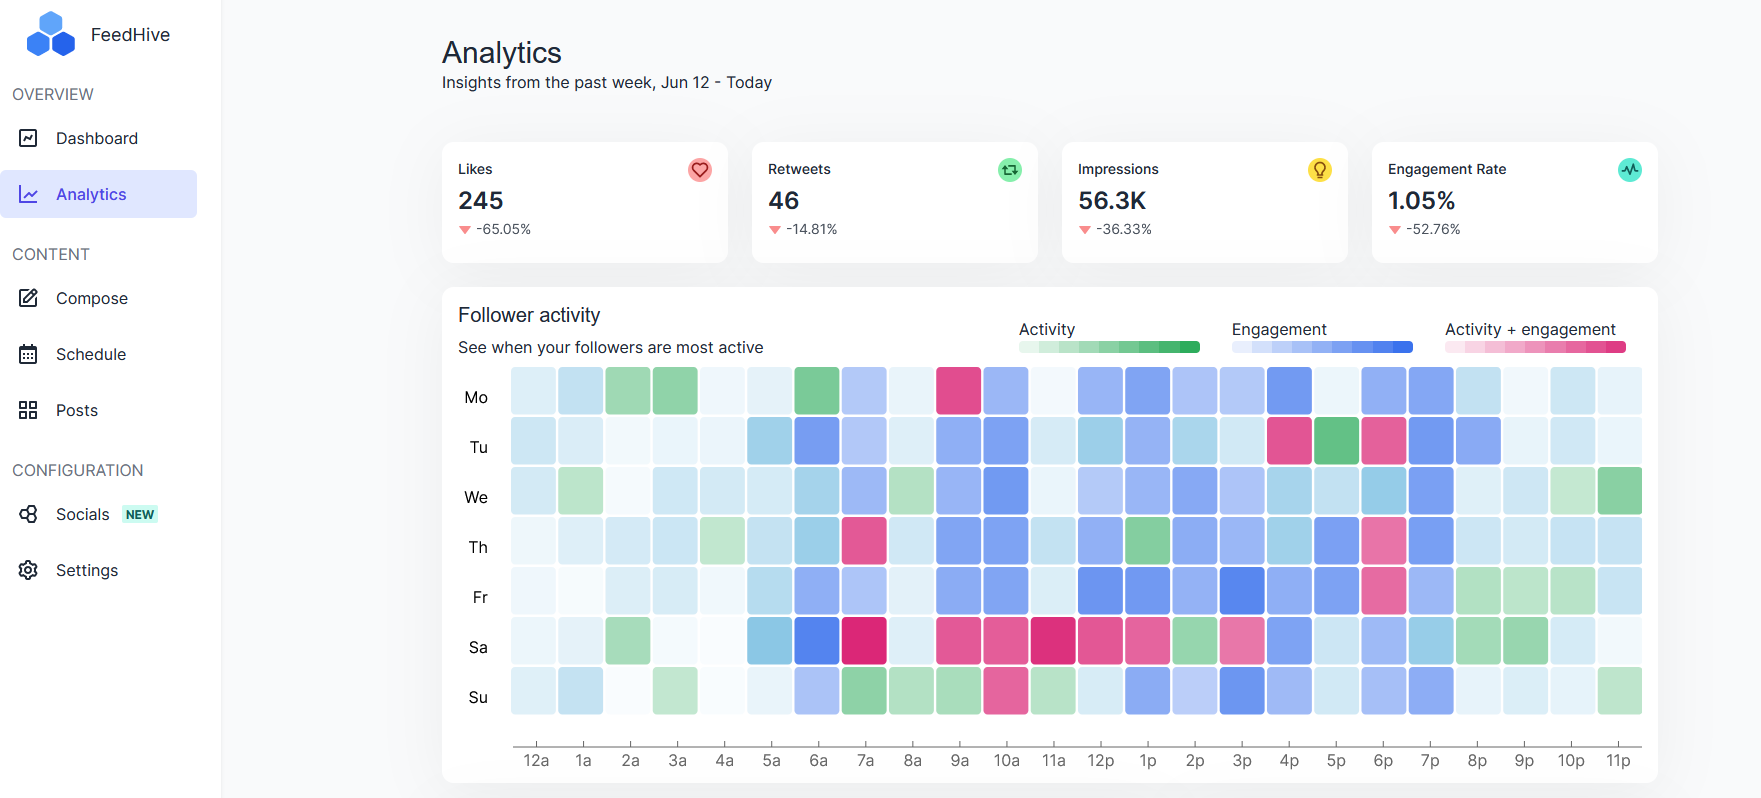
FeedHive
FeedHive isn’t just for Twitter analytics. Instead, it’s an entire suite of tools to improve your Twitter performance. Including things like scheduling tweets, tweet inspiration and of course, analytics.
You get the most out of FeedHive analytics when you’re using FeedHive as your tweet scheduler as well (which I highly recommend). If you’re interested in checking out FeedHive, you can get a free acount on their website.
Closing Out
Building a following or growing a business via Twitter isn’t a quick process. It takes time, energy and a lot of patience to build an audience that trusts you and is willing to buy products from you. But, in 2021 if you’re serious about selling products or getting more clients then you also need to be serious about your Twitter audience. I hope the metrics and tips I’ve shared in this post are helpful to you on our journey.
If you have any questions or want to chat about anything I’ve covered in this post, please feel free to reach out to me on Twitter.
Until next time, thank you for reading.